Evaluation using mir_eval#
import matplotlib.pyplot as plt

from mirdotcom import mirdotcom

mirdotcom.init()
mir_eval (documentation, paper) is a Python library containing evaluation functions for a variety of common audio and music processing tasks.
mir_eval was primarily created by Colin Raffel. This notebook was created by Brian McFee and edited by Steve Tjoa.
Why mir_eval?#
Most tasks in MIR are complicated. Evaluation is also complicated!
Any given task has many ways to evaluate a system. There is no one right away.
For example, here are issues to consider when choosing an evaluation method:
event matching
time padding
tolerance windows
vocabulary alignment
mir_eval tasks and submodules#
onset, tempo, beat
chord, key
melody, multipitch
transcription
segment, hierarchy, pattern
separation (like
bss_evalin Matlab)
Install mir_eval#
pip install mir_eval
If that doesn’t work:
pip install --no-deps mir_eval
More than metrics#
mir_eval has tools for display and sonification.
import librosa.display
import mir_eval.display
Common plots: events, labeled_intervals
pitch, multipitch, piano_roll segments, hierarchy, separation
Example: Events#
filename = mirdotcom.get_audio("jangle_pop.mp3")
y, sr = librosa.load(filename)
S = librosa.feature.melspectrogram(y=y, sr=sr)
est_beats, _ = librosa.beat.beat_track(y=y, sr=sr)
librosa.display.specshow(S, x_axis="time", y_axis="mel")
mir_eval.display.events(est_beats, color="c", alpha=0.8, linewidth=3, linestyle="--")
---------------------------------------------------------------------------
AttributeError                            Traceback (most recent call last)
<ipython-input-37-982cafece7a6> in <module>()
----> 1 librosa.display.specshow(S, x_axis='time', y_axis='mel')
      2 mir_eval.display.events(ref_beats, color='w', alpha=0.8, linewidth=3)
      3 mir_eval.display.events(est_beats, color='c', alpha=0.8, linewidth=3, linestyle='--')

AttributeError: module 'librosa' has no attribute 'display'
Example: Labeled Intervals#
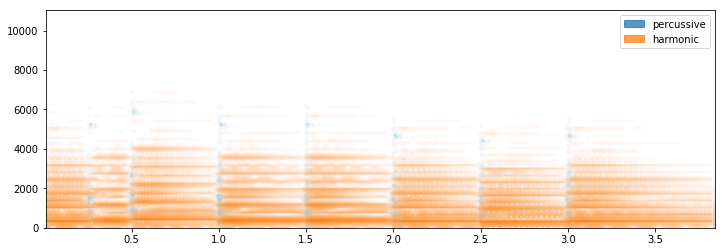
Example: Source Separation#
y_harm, y_perc = librosa.effects.hpss(y, margin=8)
plt.figure(figsize=(12, 4))
mir_eval.display.separation([y_perc, y_harm], sr, labels=["percussive", "harmonic"])
plt.legend()
<matplotlib.legend.Legend at 0x117a2f048>