Evaluation Example: Beat Tracking#
import IPython.display as ipd
import matplotlib.pyplot as plt
import librosa.display
import mir_eval
import numpy

from mirdotcom import mirdotcom

mirdotcom.init()
Evaluation method: compute the error between the estimated beat times and some reference list of beat locations. Many metrics additionally compare the beat sequences at different metric levels in order to deal with the ambiguity of tempo.
Let’s evaluate a beat detector on the following audio:
filename = mirdotcom.get_audio("prelude_cmaj.wav")
y, sr = librosa.load(filename)
ipd.Audio(y, rate=sr)
Detect Beats#
Estimate the beats using beat_track:
est_tempo, est_beats = librosa.beat.beat_track(y=y, sr=sr, bpm=120)
est_beats = librosa.frames_to_time(est_beats, sr=sr)
est_beats
array([1.021678  , 1.53251701, 1.9969161 , 2.48453515, 2.9721542 ,
       3.43655329, 3.90095238, 4.41179138, 4.89941043, 5.38702948,
       5.85142857, 6.33904762, 6.82666667, 7.29106576])
Load a fictional reference annotation.
ref_beats = numpy.array(
    [
        0,
        0.50,
        1.02,
        1.53,
        1.99,
        2.48,
        2.97,
        3.43,
        3.90,
        4.41,
        4.89,
        5.38,
        5.85,
        6.33,
        6.82,
        7.29,
        7.70,
    ]
)
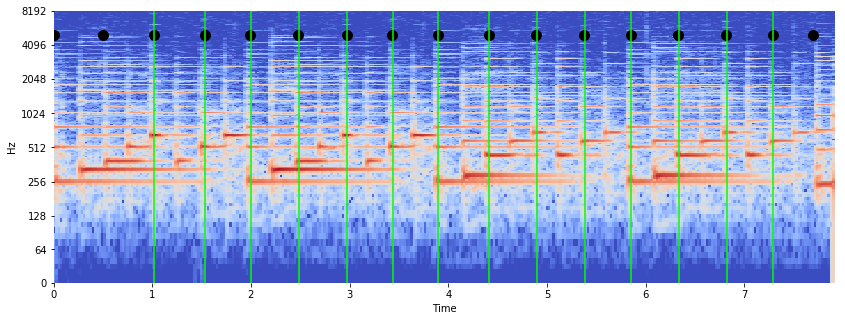
Plot the estimated and reference beats together.
D = librosa.stft(y)
S = abs(D)
S_db = librosa.amplitude_to_db(S)
librosa.display.specshow(S_db, sr=sr, x_axis="time", y_axis="log")
plt.ylim(0, 8192)
plt.vlines(est_beats, 0, 8192, color="#00ff00")
plt.scatter(ref_beats, 5000 * numpy.ones_like(ref_beats), color="k", s=100)
<matplotlib.collections.PathCollection at 0x104122e10>
Evaluate#
Evaluate using mir_eval.beat.evaluate:
mir_eval.beat.evaluate(ref_beats, est_beats)
---------------------------------------------------------------------------
TypeError                                 Traceback (most recent call last)
<ipython-input-31-6a77a8e60fa6> in <module>()
----> 1 mir_eval.beat.evaluate(ref_beats, est_beats)

~/anaconda3/lib/python3.6/site-packages/mir_eval/beat.py in evaluate(reference_beats, estimated_beats, **kwargs)
    751     # P-Score
    752     scores['P-score'] = util.filter_kwargs(p_score, reference_beats,
--> 753                                            estimated_beats, **kwargs)
    754
    755     # Continuity metrics

~/anaconda3/lib/python3.6/site-packages/mir_eval/util.py in filter_kwargs(_function, *args, **kwargs)
    872             filtered_kwargs[kwarg] = value
    873     # Call the function with the supplied args and the filtered kwarg dict
--> 874     return _function(*args, **filtered_kwargs)
    875
    876

~/anaconda3/lib/python3.6/site-packages/mir_eval/beat.py in p_score(reference_beats, estimated_beats, p_score_threshold)
    407     start = middle_lag - win_size
    408     end = middle_lag + win_size + 1
--> 409     train_correlation = train_correlation[start:end]
    410     # Compute and return the P-score
    411     n_beats = np.max([estimated_beats.shape[0], reference_beats.shape[0]])

TypeError: slice indices must be integers or None or have an __index__ method
Hidden benefits
Input validation! Many errors can be traced back to ill-formatted data.
Standardized behavior, full test coverage.
More than metrics#
mir_eval has tools for display and sonification.
import librosa.display
import mir_eval.display
Common plots: events, labeled_intervals
pitch, multipitch, piano_roll segments, hierarchy, separation
Example: Events#
librosa.display.specshow(S, x_axis="time", y_axis="mel")
mir_eval.display.events(ref_beats, color="w", alpha=0.8, linewidth=3)
mir_eval.display.events(est_beats, color="c", alpha=0.8, linewidth=3, linestyle="--")
Example: Labeled Intervals#
Example: Source Separation#
y_harm, y_perc = librosa.effects.hpss(y, margin=8)
plt.figure(figsize=(12, 4))
mir_eval.display.separation([y_perc, y_harm], sr, labels=["percussive", "harmonic"])
plt.legend()