Fourier Transform#
import IPython.display as ipd
import matplotlib.pyplot as plt
import librosa
import numpy
import scipy

from mirdotcom import mirdotcom

mirdotcom.init()
Let’s download an audio file:
filename = mirdotcom.get_audio("c_strum.wav")
x, sr = librosa.load(filename)
print(x.shape)
print(sr)
(102400,)
22050
Listen to the audio file:
ipd.Audio(x, rate=sr)
Fourier Transform#
The Fourier Transform (Wikipedia) is one of the most fundamental operations in applied mathematics and signal processing.
It transforms our time-domain signal into the frequency domain. Whereas the time domain expresses our signal as a sequence of samples, the frequency domain expresses our signal as a superposition of sinusoids of varying magnitudes, frequencies, and phase offsets.
To compute a Fourier transform in NumPy or SciPy, use scipy.fft:
X = scipy.fft.fft(x)
X_mag = numpy.absolute(X)
f = numpy.linspace(0, sr, len(X_mag))  # frequency variable
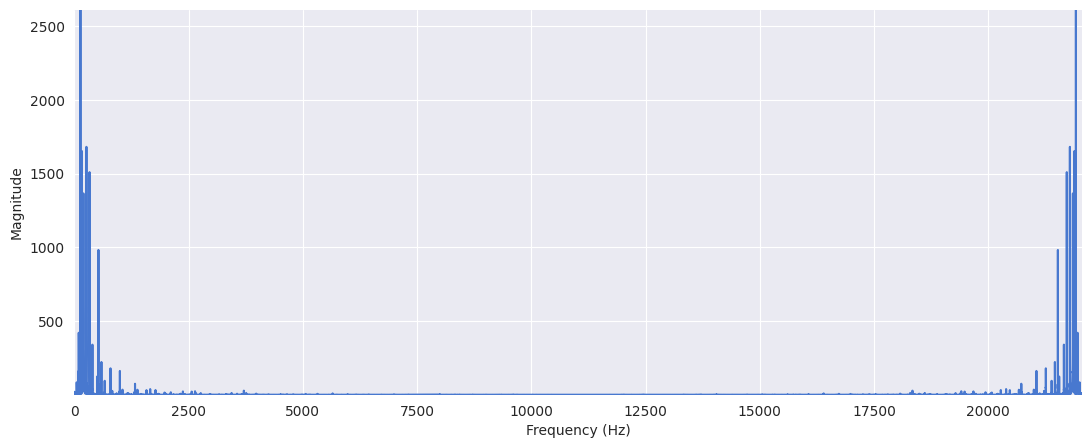
Plot the spectrum:
plt.figure(figsize=(13, 5))
plt.plot(f, X_mag)  # magnitude spectrum
plt.xlabel("Frequency (Hz)")
plt.ylabel("Magnitude")
Text(0, 0.5, 'Magnitude')
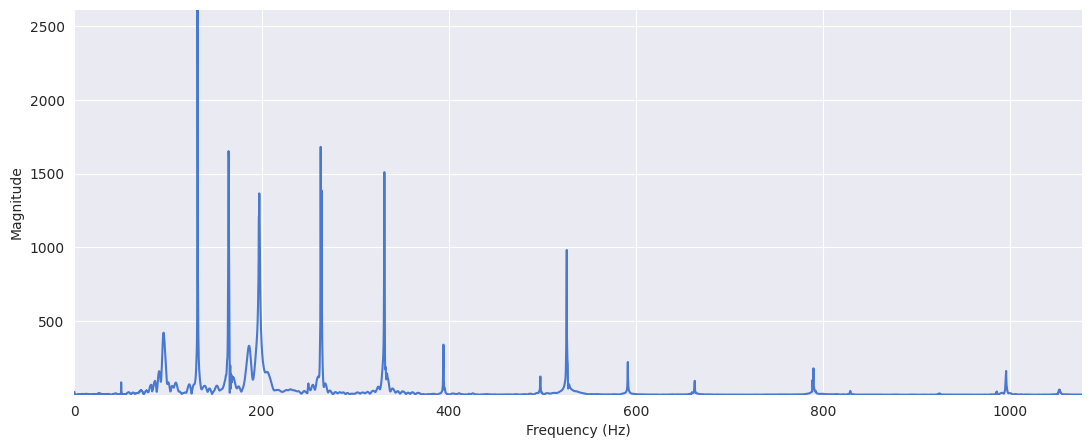
Zoom in:
plt.figure(figsize=(13, 5))
plt.plot(f[:5000], X_mag[:5000])
plt.xlabel("Frequency (Hz)")
plt.ylabel("Magnitude")
Text(0, 0.5, 'Magnitude')