Drum Transcription using ADTLib#
import IPython.display as ipd
import matplotlib.pyplot as plt
import librosa
import numpy
import scipy
from ADTLib import ADT

from mirdotcom import mirdotcom

mirdotcom.init()
This notebook requires ADTLib. See ADTLib repo for installation instructions. If you experience problems, be sure to install the latest versions of tensorflow and dask.
Load the audio file into an array:
filename = mirdotcom.get_audio("classic_rock_beat.mp3")
x, sr = librosa.load(filename)
Listen to the signal:
ipd.Audio(x, rate=sr)
ADTLib#
Use ADTLib to identify the location and types of each onset:
drum_onsets = ADT([filename])[0]
INFO:tensorflow:Restoring parameters from /Users/stjoa/anaconda3/lib/python3.6/site-packages/ADTLib/files/KickADTLibAll
INFO:tensorflow:Restoring parameters from /Users/stjoa/anaconda3/lib/python3.6/site-packages/ADTLib/files/SnareADTLibAll
INFO:tensorflow:Restoring parameters from /Users/stjoa/anaconda3/lib/python3.6/site-packages/ADTLib/files/HihatADTLibAll
drum_onsets
{'Hihat': array([0.42956916, 0.65015873, 0.85913832, 1.07972789, 1.28870748,
        1.50929705, 1.71827664, 1.93886621, 2.1478458 , 2.36843537,
        2.57741497, 2.78639456, 3.00698413, 3.21596372, 3.42494331,
        3.64553288, 3.86612245, 4.07510204, 4.28408163, 4.5046712 ,
        4.72526077, 4.93424036, 5.15482993, 5.36380952, 5.57278912,
        5.79337868, 6.00235828, 6.21133787, 6.43192744, 6.64090703]),
 'Kick': array([1.49768707, 1.92725624, 2.1478458 , 2.78639456, 3.21596372,
        3.42494331, 4.07510204, 4.93424036, 5.57278912, 5.78176871,
        6.21133787, 6.64090703]),
 'Snare': array([0.85913832, 2.57741497, 4.28408163, 6.43192744])}
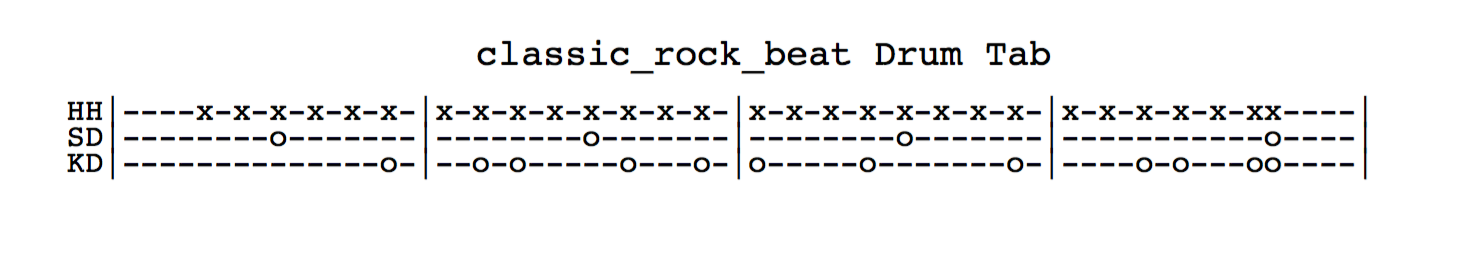
ADT also produces the file classic_rock_beat_drumtab.pdf which looks like this:
ipd.Image("../../assets/img/classic_rock_beat_drumtab.png")
Listen to onsets#
For each type of drum, create a click track from the onsets, and listen to it with the original signal.
Bass/kick drum:
clicks = librosa.clicks(times=drum_onsets["Kick"], sr=sr, length=len(x))
ipd.Audio(x + clicks, rate=sr)
Snare drum:
clicks = librosa.clicks(times=drum_onsets["Snare"], sr=sr, length=len(x))
ipd.Audio(x + clicks, rate=sr)
Hi-hat:
clicks = librosa.clicks(times=drum_onsets["Hihat"], sr=sr, length=len(x))
ipd.Audio(x + clicks, rate=sr)
Visualize spectrum#
For each drum type, let’s compute an average drum beat from the original signal and visualize the spectrum for that average drum beat.
Create a function that returns a log-amplitude spectrum of an average drum beat for a particular drum type:
def plot_avg_spectrum(x, onset_times):

    # Compute average drum beat signal.
    frame_sz = int(0.100 * sr)

    def normalize(z):
        return z / scipy.linalg.norm(z)

    onset_samples = librosa.time_to_samples(onset_times, sr=sr)
    x_avg = numpy.mean([normalize(x[i : i + frame_sz]) for i in onset_samples], axis=0)

    # Compute average spectrum.
    X = librosa.spectrum.fft.fft(x_avg)
    Xmag = librosa.amplitude_to_db(abs(X))

    # Plot spectrum.
    f = numpy.arange(frame_sz) * sr / frame_sz
    Nd2 = int(frame_sz / 2)
    plt.figure(figsize=(14, 5))
    plt.plot(f[:Nd2], Xmag[:Nd2])
    plt.xlim(xmax=f[Nd2])
    plt.ylim([-50, 20])
    plt.xlabel("Frequency (Hertz)")
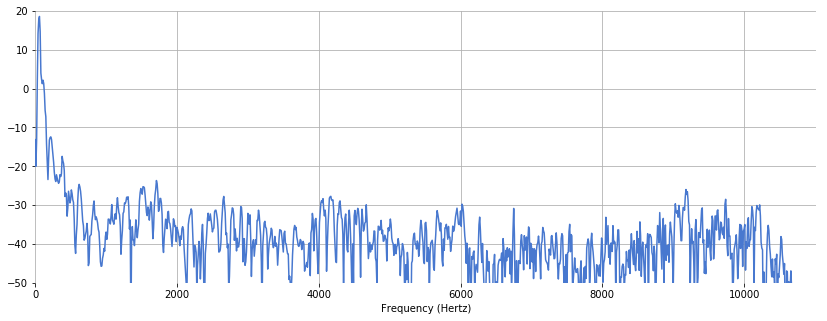
Plot the spectrum for an average bass drum:
plot_avg_spectrum(x, drum_onsets["Kick"])
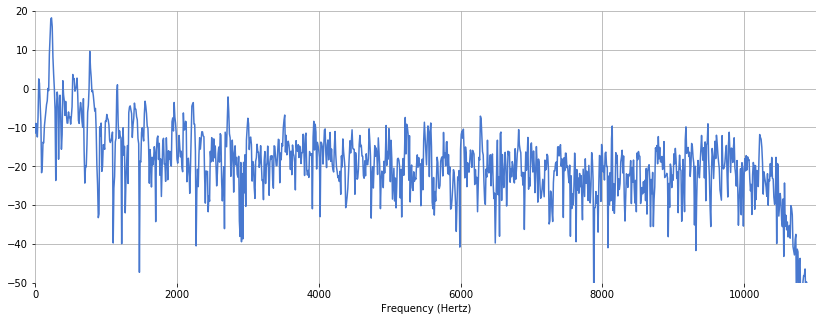
Snare drum:
plot_avg_spectrum(x, drum_onsets["Snare"])
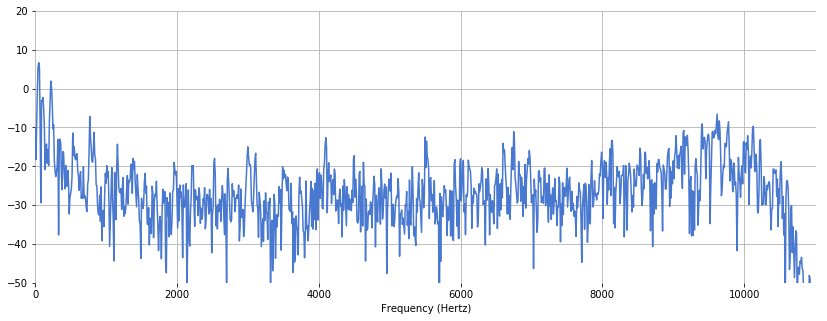
Hi-hat:
plot_avg_spectrum(x, drum_onsets["Hihat"])