Energy and RMSE#
import IPython.display as ipd
import matplotlib.pyplot as plt
import librosa
import librosa.display
import numpy

from mirdotcom import mirdotcom

mirdotcom.init()
The energy ([Wikipedia](https://en.wikipedia.org/wiki/Energy_(signal_processing)); FMP, p. 66) of a signal corresponds to the total magntiude of the signal. For audio signals, that roughly corresponds to how loud the signal is. The energy in a signal is defined as
The root-mean-square energy (RMSE) in a signal is defined as
Let’s load a signal:
fp = mirdotcom.get_audio("simple_loop.wav")
x, sr = librosa.load(fp)
sr
22050
x.shape
(49613,)
librosa.get_duration(y=x, sr=sr)
2.2500226757369615
Listen to the signal:
ipd.Audio(x, rate=sr)
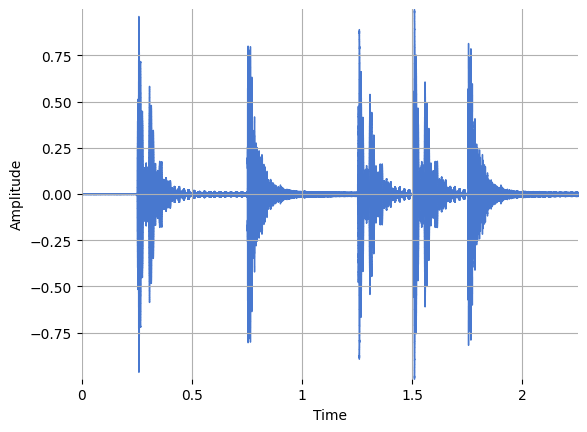
Plot the signal:
librosa.display.waveshow(x, sr=sr)
plt.ylabel("Amplitude")
Text(22.472222222222214, 0.5, 'Amplitude')
Compute the short-time energy using a list comprehension:
hop_length = 256
frame_length = 512
energy = numpy.array(
    [sum(abs(x[i : i + frame_length] ** 2)) for i in range(0, len(x), hop_length)]
)
energy.shape
(194,)
Compute the RMSE using librosa.feature.rms:
rmse = librosa.feature.rms(
    y=x, frame_length=frame_length, hop_length=hop_length, center=True
)
rmse.shape
(1, 194)
rmse = rmse[0]
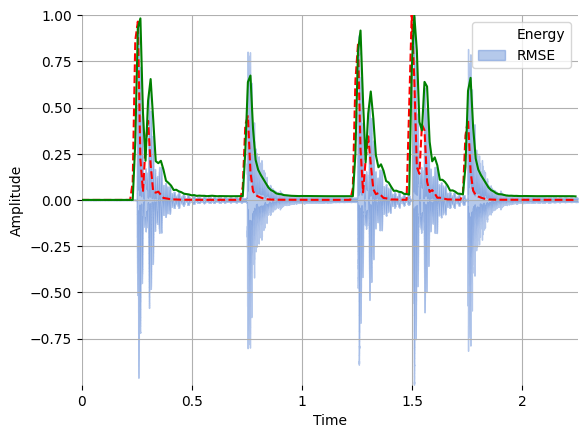
Plot both the energy and RMSE along with the waveform:
frames = range(len(energy))
t = librosa.frames_to_time(frames, sr=sr, hop_length=hop_length)
librosa.display.waveshow(x, sr=sr, alpha=0.4)
plt.plot(t, energy / energy.max(), "r--")  # normalized for visualization
plt.plot(t[: len(rmse)], rmse / rmse.max(), color="g")  # normalized for visualization
plt.legend(("Energy", "RMSE"))
plt.ylabel("Amplitude")
Text(22.472222222222214, 0.5, 'Amplitude')
Questions#
Write a function, strip, that removes leading silence from a signal. Make sure it works for a variety of signals recorded in different environments and with different signal-to-noise ratios (SNR).
def strip(x, frame_length, hop_length):

    # Compute RMSE.
    rmse = librosa.feature.rms(
        y=x, frame_length=frame_length, hop_length=hop_length, center=True
    )

    # Identify the first frame index where RMSE exceeds a threshold.
    thresh = 0.01
    frame_index = 0
    while rmse[0][frame_index] < thresh:
        frame_index += 1

    # Convert units of frames to samples.
    start_sample_index = librosa.frames_to_samples(frame_index, hop_length=hop_length)

    # Return the trimmed signal.
    return x[start_sample_index:]
Let’s see if it works.
y = strip(x, frame_length, hop_length)
ipd.Audio(y, rate=sr)
librosa.display.waveshow(y, sr=sr)
plt.ylabel("Amplitude")
Text(22.472222222222214, 0.5, 'Amplitude')
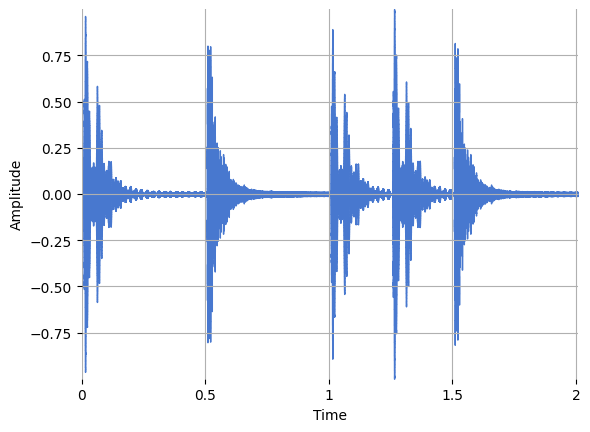
It worked!